Pie Chart
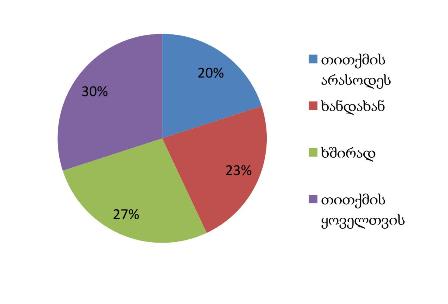
თვისებრივ მონაცემთა განაწილების გრაფიკული წარმოდგენა. მაგალითად, გამოცდის წინ სტუდენტთა შფოთვის დონის გამოსაკვლევად შევსებული კითხვარის მიხედვით შემდეგი განაწილება მივიღეთ: 1) თითქმის არასოდეს 20%, 2) ხანდახან 23%, 3) ხშირად 27%, 4) თითქმის ყოველთვის 30%. შესაბამისი წრიული დიაგრამაა, სადაც წრე დაყოფილია 360 გრადუსის შესაბამისად 20, 23, 27 და 30 პროცენტის გრადუსული ზომის სექტორებად.
***
გამოყენებული ლიტერატურა:
Field, A. (2013). Discovering Statistics Using IBM SPSS Statistics. SAGE Publications Ltd.
კისი, ჰ. (2008). სტატისტიკა სოციალურ მეცნიერებებში. სოციალურ მეცნიერებათა ცენტრი. თბილისის უნივერსიტეტის გამომცემლობა
კატეგორია: